


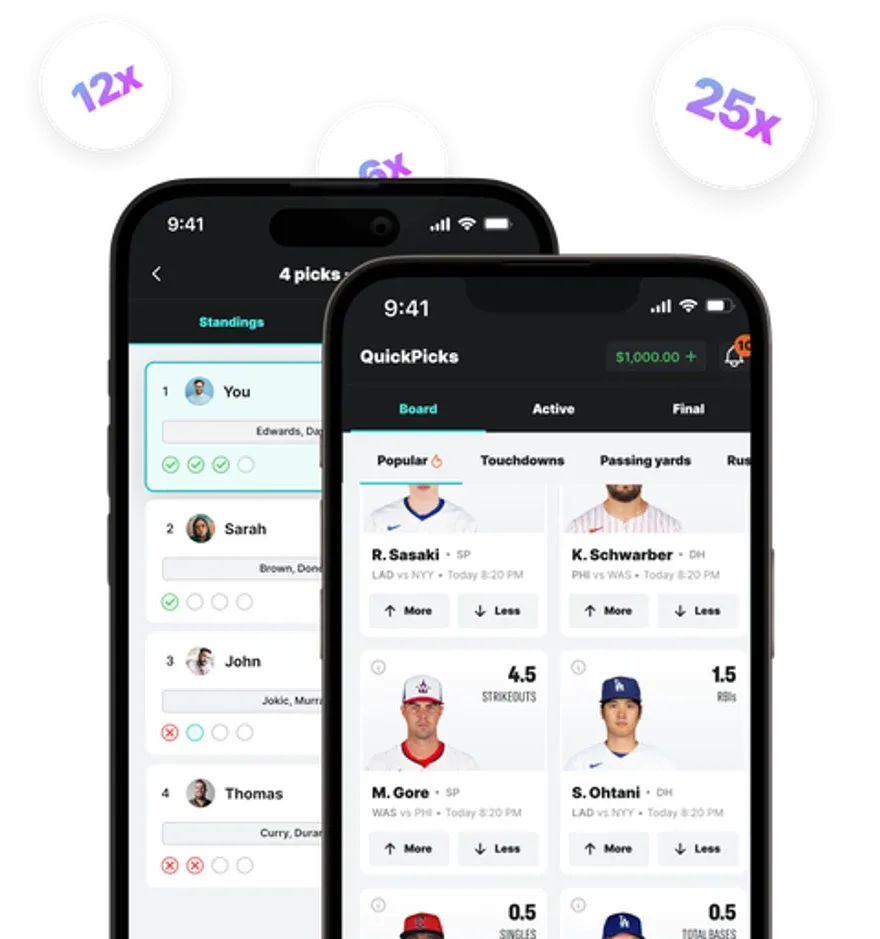
A star's stat line pops up near his season scoring average. Your thumb is already on More, because he's a star and stars score.
Hold that thought.
We pulled every 2025-26 regular-season game for the league's 30 highest scorers, 1,974 games in all, and counted how often each player beat his own points per game. Being a star didn't tip the scale. Minutes, usage and pace did.
Key findings on star scoring
A coin flip with a few tells
By the numbers
- 49.4% — of games where a top-30 scorer beat his own points per game (Basketball-Reference game logs, 2025-26 regular season, 30 players, 1,974 games)
- 48.1% — of games that landed within 5 points of the player's average (Basketball-Reference game logs, 2025-26 regular season)
- 84.2% — beat rate when minutes and usage both ran at or above the player's norm (Basketball-Reference game logs, 2025-26 regular season (basic + advanced))
- 54.6% — beat rate against the 10 fastest-paced opponents, vs 45.9% against the 10 slowest (Basketball-Reference game logs + team pace, 2025-26)
- 40.0-58.6% — range of individual beat rates, James Harden to Donovan Mitchell (Basketball-Reference game logs, 2025-26 regular season)
The short version for NBA DFS players:
- The 30 top scorers beat their own scoring average in 49.4% of games.
- The top 10 beat it 50.1% of the time. Ranks 11 to 30 beat it 49.0% of the time.
- Only 48.1% of games finished within 5 points of the average, either way.
- When minutes and usage both ran at or above normal, stars beat their average 84.2% of the time. When both ran below, 13.6%.
- Against the fastest-paced opponents, 54.6%. Against the slowest, 45.9%.
- Home and road were a wash: 49.3% and 49.5%.
How we built the sample
1,974 box scores & one simple test
Every number here comes from Basketball-Reference's 2025-26 NBA regular season, the most recent complete season. We started from its per-game table of NBA player stats and took the 30 highest scorers in points per game among players who appeared in at least 50 games, ranked on unrounded averages. That matters at the cutoff, where Shaedon Sharpe (20.84) edges Nickeil Alexander-Walker (20.82). Team pace and defensive ratings come from its NBA season stats page.
The 50-game floor keeps a few big names out. Giannis Antetokounmpo (36 games), Joel Embiid (38), Lauri Markkanen (42) and Stephen Curry (43) all averaged more than 26 points, but too few games to judge night to night.
For each player we pulled his regular-season game log and advanced game log: 1,974 games played between Oct. 21, 2025 and April 12, 2026. Only games he actually played count. DNPs, inactive nights and injury absences are left out, and playoff games aren't included. James Harden played for two teams, and both stints count.
- Beat the average: points in a game strictly above the player's own full-season 2025-26 points per game, the mean of every game he played, including that one. Our averages match Basketball-Reference's within 0.05 points.
- High minutes, high usage: a game at or above the player's own full-season mean, measured the same way. Usage rate is Basketball-Reference's estimate of the percentage of team plays a player uses while on the floor.
- Pace and defense: opponents ranked by full-season pace (an estimate of possessions per 48 minutes) and defensive rating (an estimate of points allowed per 100 possessions). We compared the 10 fastest teams with the 10 slowest, and the 10 best defenses with the 10 worst.
The data was pulled Oct. 30, 2026. These are NBA stats from finished games, so read them as patterns, not promises. The raw rows and script are kept with this post.
How often stars beat their points per game
Star power doesn't move the needle
Across 1,974 games, the 30 top scorers topped their own points per game 975 times. That's 49.4%.
Here's the flip. A star's average isn't a floor he clears most nights. It's the middle of his range, and he lands on either side about equally. Across the group, medians and means nearly cancel out: the typical player's median game sat 0.08 points below his average, though single players drifted as far as two points either way.
The spread is the real story. Only 48.1% of games finished within 5 points of the average. One game in ten (10.0%) ran 10 or more points above it, and one in ten (10.0%) ran 10 or more below.
NBA scoring leaders vs the rest
The top 10 aren't safer, just steadier
Split the sample into the 2025-26 NBA points per game leaders, ranks 1 to 10, and the next 20. The beat rates barely differ: 50.1% for the top 10 and 49.0% for the rest.
What differs is the size of the swing compared with the average. The NBA scoring leaders had a typical standard deviation of 8.3 points, a little wider than the rest at 7.7, but on much bigger averages. Divide swing by average and the top 10 come out at 0.29, the rest at 0.34.
Inside the top 10, the profiles looked nothing alike. Shai Gilgeous-Alexander beat his 31.1 average in only 41.2% of games, yet finished within 5 points of it 55.9% of the time. Anthony Edwards beat his 28.8 in 52.5% of games, but only 34.4% of his games landed within 5 points. One lives just under his mean. The other swings both ways.
Top 10 scorers, 2025-26 regular season (Basketball-Reference game logs)
| Player | Points per game | Median game | Beat average | Within 5 points |
|---|---|---|---|---|
| Luka Dončić | 33.5 | 34 | 51.6% | 46.9% |
| Shai Gilgeous-Alexander | 31.1 | 30 | 41.2% | 55.9% |
| Anthony Edwards | 28.8 | 30 | 52.5% | 34.4% |
| Jaylen Brown | 28.7 | 29 | 56.3% | 57.7% |
| Tyrese Maxey | 28.3 | 28 | 45.7% | 47.1% |
| Kawhi Leonard | 27.9 | 27 | 46.2% | 58.5% |
| Donovan Mitchell | 27.9 | 29 | 58.6% | 44.3% |
| Nikola Jokić | 27.7 | 26 | 47.7% | 43.1% |
| Devin Booker | 26.1 | 26.5 | 50.0% | 48.4% |
| Jalen Brunson | 26.0 | 27 | 51.4% | 51.4% |
Home vs road games
Home court barely registered
Home cooking didn't show up. Stars beat their average in 49.3% of 992 home games and 49.5% of 982 road games.
That gap is under one percentage point, too small to act on. If your read on a stat line starts with "he's at home," the sample says you're leaning on almost nothing.
What drives a big night
Minutes & shots beat reputation
If being a star doesn't predict a big night, what does? Three things in the logs moved the beat rate a lot or a fair amount: minutes, usage and the opponent's pace. Opponent defense moved it a little. For more on reading opponents, Splash has a primer on player matchups in daily fantasy.
Minutes & NBA usage rate
Time on the floor is everything
When a star played at or above his usual minutes, he beat his scoring average 61.0% of the time. Below his usual minutes, 33.9%.
NBA usage rate split it even harder: 71.1% at or above his season usage, 28.6% below it. Stack the two and the gap gets huge. Both high, 84.2%. Both low, 13.6%.
Two honest caveats. Usage measures the plays a player finishes, so it overlaps with scoring by design. And both numbers are only known after the final buzzer. What you can watch beforehand is anything that changes them, like a teammate ruled out or a minutes limit.
Share of games above the player's scoring average
| Share of games above the player's scoring average | Value |
|---|---|
| Minutes & usage both high | 84.2% |
| Usage high | 71.1% |
| Minutes high | 61.0% |
| Minutes low | 33.9% |
| Usage low | 28.6% |
| Minutes & usage both low | 13.6% |
Source: Basketball-Reference basic + advanced game logs, 2025-26 regular season, 30 players, 1,974 games
Points are only one piece of NBA fantasy points, so we ran the same test on points plus rebounds plus assists. Stars beat their combined average in 50.8% of games. Same coin flip, different stat.
Pace & matchup
Fast opponents help, good defenses hurt
Against the 10 fastest-paced teams of 2025-26, stars beat their average 54.6% of the time. Against the 10 slowest, 45.9%. More possessions means more chances to score, and the logs show it.
Defense mattered less. Against the 10 best defensive ratings, 46.3%. Against the 10 worst, 51.7%. A real tilt, smaller than pace.
Neither split comes close to the minutes and usage gap. Pace and defense nudge a coin flip. Role changes it.
Share of games above average, by opponent
| Share of games above average, by opponent | Value |
|---|---|
| 10 fastest-paced opponents | 54.6% |
| 10 worst defenses | 51.7% |
| 10 best defenses | 46.3% |
| 10 slowest-paced opponents | 45.9% |
Source: Basketball-Reference game logs + team pace and defensive rating, 2025-26 regular season
Scoring averages vs NBA DFS projections
An average isn't a forecast
A season average summarizes games already played. A projection is an estimate for one game that hasn't happened yet. Any projection that leans mostly on the season number inherits everything above.
The data shows why the season number alone is a soft forecast. A star's game lands within 5 points of his average less than half the time. Individual standard deviations in the sample ran from 6.1 points (LeBron James) to 10.1 (Anthony Edwards).
Shape matters too. Donovan Mitchell beat his average in 58.6% of games, the best rate in the sample, but also fell 10 or more points short in 17.1%. Kawhi Leonard fell that far short in just 1.5%. Two players with the same 27.9 average, two very different nights to plan around.
Splash Tiers sorts players into tiers by projected fantasy points each slate, and two names in the same tier can carry ranges this different. So treat any of the NBA DFS projections you read as the center, then ask the two questions this data says matter. Will his minutes and role hold? How fast does tonight's opponent play? For the bigger roster picture, read Splash's guide to building a winning lineup.
Use the data in your QuickPicks entries
Turn base rates into sharper calls
In the Splash QuickPicks game, you pick More or Less on player stat lines. Entries need at least two picks with players from at least two teams, and you play against other fans, not the house. Every pick card shows its implied probability.
That last detail is where this data earns its keep. If a points line sits near a star's season average, history says the call starts close to 50/50 on its own. Your edge has to come from context.
- Check minutes first. Above-normal minutes beat the average 61.0% of the time in this sample. Below-normal, 33.9%.
- Look for a bigger role. When usage ran high, stars cleared their average 71.1% of the time.
- Lean toward fast games. 54.6% against the fastest-paced opponents, 45.9% against the slowest.
- Ignore home and road. 49.3% vs 49.5% is too thin to build on.
- Know the player's shape. Some stars live near their average. Others swing 10 points either way.
Build NBA DFS picks the way you'd fill out a good NBA pick em sheet: one clear reason per pick, spread across different games. It won't promise a result. It does beat tapping More because the name is famous.
Current offers, including any deposit promo offer, show in the app.
Frequently asked questions
Quick answers from the game logs
About half the time. In the 2025-26 regular season, the 30 highest scorers with 50 or more games beat their own points per game in 49.4% of 1,974 games, per Basketball-Reference game logs. Individual rates ran from 40.0% (James Harden) to 58.6% (Donovan Mitchell).
Slightly, relative to their size. The top 10 scorers beat their average 50.1% of the time versus 49.0% for ranks 11 to 30. Their raw swing was a bit wider, 8.3 points against 7.7, but on bigger averages, so it was smaller as a share of what they score.
In this sample, minutes and usage rate. Stars beat their scoring average 84.2% of the time when both ran at or above their norm and 13.6% when both ran below. Opponent pace mattered less, and home versus road barely mattered at all.
Not in 2025-26. Home games beat the player's average 49.3% of the time and road games 49.5%, across 992 home and 982 road games for the 30 top scorers. The difference is too small to use when you set a pick.
A little. Against the 10 best defensive ratings of 2025-26, stars beat their average 46.3% of the time. Against the 10 worst, 51.7%. Opponent pace moved the number more: 54.6% against the fastest teams and 45.9% against the slowest.